A deep-learning algorithm could detect earthquakes by filtering out city noise
The process of predicting and monitoring Earthquakes in cities is crucial and a challenging task due to the strong anthropogenic noise inherent to urban seismic recordings. And an unexpected earthquakes will not allow the people to have enough time to evacuate and that will lead to the lost of millions of lives, not to mention the destruction of billion of dollars of infrastructures. Understanding the potential risks, the researchers from Stanford have found a way to get a clear signal in order to give a better prediction. They have created an Algorithm called UrbanDenoiser and you can read more in this article: https://www.science.org/doi/10.1126/sciadv.abl3564. The idea is to filtering out background seismic noise can it can boost the overall signal quality and recover signals that may have previously too weak to register.
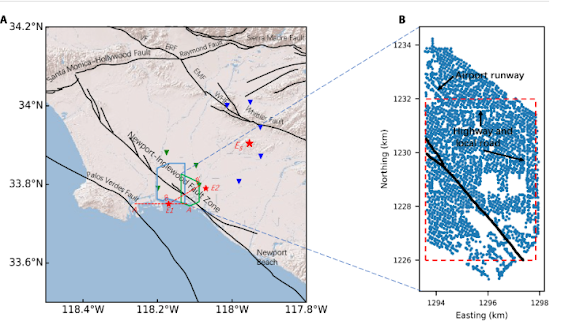 FIG 1: Los Angeles Basin and Long Beach dense nodal deployment.


In figure 1 above, you can see how they set up one of the experiments which include 2 maps A and B. In map A, the red stars which stated as E1 and E2 show the epicenter of two earthquakes that occurred during the deployment of Long Beach phase. The red line from A to A` is a profile across the
epicenter E1. BB′ is a line across the epicenter E1 and subvertical to the surficial trace of the Newport-Inglewood Fault Zone. The red star, ES, shows the mainshock epicenter of the 2014 La Habra earthquake sequence. Green and blue inverted triangles represent the regional stations of the Southern California Seismic Network (SCSN) close
to the Long Beach phase B deployment and the earthquake sequence, respectively. In map B which is the map of Long Beach phase B deployment. The strip of missing sensors in the top
left is the Long Beach Airport runway. The narrow gap in the northern and eastern parts of the deployment tracks the highway and local roads. Black lines show the
mapped surface trace of the Newport-Inglewood Fault. The red dashed rectangle is the superficial boundary of the three-dimensional (3D) imaging volume and horizontal slices we used in our analysis. Their deep-learning algorithm is trained on data sets of 80,000 samples of urban seismic noise and 33,751 samples that indicate earthquake activity. They were collected from busy Long Beach and rural San Jacinto.
When applied to the data sets taken from the Long Beach area, the algorithm detected substantially more earthquakes and made it easier to work out how and where they started. And when applied to data from a 2014 earthquake in La Habra, also in California, the team observed four times more seismic detections in the "denoised" data compared with the officially recorded number.

Fig 2. Seismogram recorded by station R1134_5043 and the denoised version (local time)
Figure 2A shows a 1-day seismogram recorded by a randomly
selected receiver that reveals a strong time-varying behavior in amplitude for local time 6:00 to 22:00 when the noise level is high
versus 22:00 to 6:00+1 when the noise level is low. Figure 2B shows
the denoised results from Fig. 2A, which eliminates the daytime/
nighttime variation.

Fig 3.Seven-day earthquake BP location results in horizontal slices at different depth ranges of 0 to 5 km, 5 to 10 km, 10 to 15 km, 15 to 20 km, and 20 to 25 km
Figure 3 shows the 7-day earthquake localization results from
the original data which can be seen in figure 3A and the denoised data as shown in figure 3B in horizontal slices at different depth ranges. Each dot represents the
detection and size scale with the back-projected amplitude. They had removed the detections located at the boundary of the volume to
avoid interference from regional events (among all the detections,
the ratio between the detections inside and outside of the volume is
about 1:0.71). The earthquake distribution pattern of the denoised
data differs from that of the original data in the following aspects:
1) At 0 to 5 km depths, the detections of the original data were
dispersed throughout the imaging area, while most of the detections
by the denoised data were widely scattered around the fault trace;
2) At 15 to 20 km depths, the detections by the denoised data
track the fault trace closely, while this trend in the original data
is much weaker;
3) They found some detections deeper than 20 km in the original
data, but very few of these were indicated in the denoised data. They had validated their detection/localization results in figure 3B by
examining the seismic waveforms from the dense array dataset. They had selected one detection at (1296.8, 1226.8, and 5 km) and plotted the
seismic profiles spanning the duration of the earthquake.
In conclusion, this is an interesting topic as well as promising research as with the deep-learning algorithm, we can predict the earthquakes which might happen in urban area and minimize the consequences. Hopefully in the future, this algorithm can provide more reliable data which will save countless life.


